
Analysis Report
Analysis Report can be used to further check the click and conversion characteristics of Campaign, such as the traffic GEO distribution, Device information and so on. You can analyze the performance of the specific offer or affiliate by specifying filter range and customize the Column part in Analysis Report.
You can go to "Reports -> Analysis Report" to check this report.
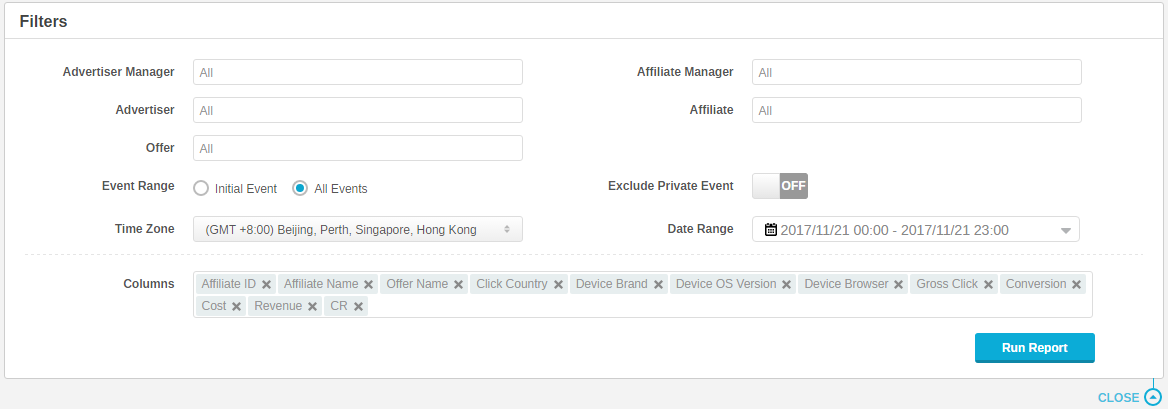
Fig 1. Filter panel
Notice: You can minimize the Filter panel by clicking the icon on the bottom right corner. For better user-experience..
All Filter Options in Analysis Report are as follows:
1. Advertiser Manager: Filter advertiser managers. You can check the offer's traffic data of specific employee via this option.
2. Advertiser: Filter advertisers to check the data of specific advertiser.
3. Offer: Filter offers to check the traffic characteristics of specific offer.
4. Affiliate Manager: Filter affiliate managers. You can check the traffic characteristics of affiliates who are managed by specific employee via this option.
5. Affiliate: Filter affiliates to check the traffic characteristics of specific affiliate.
6. Event Range: Filter event range.
A. Choose All Event: You can see all events' performance of the offer.
B. Choose Initial Event: You can only see the initial event's traffic data of the offer.
7. Exclude Private Event: Report will not display the data of Offer’s Private Event after open the " Exclude Private Event ".
8. Time Zone: Report by default displays the time zone according to the time zone settings in "Setup -> Settings -> General Settings". If you want to check the report with your Advertiser or publisher, you can switch it to the corresponding time zone to check.
9. Date Range: Filter date range. System provides some fast labels of:
A. Today
B. Yesterday
C. Last 7 Days
D. Last 30 Days
E. This Month
F. Last Month
This makes it more convenient to choose the time range. At the same time, you can also customize the time range by choosing the appropriate date and even the hour.
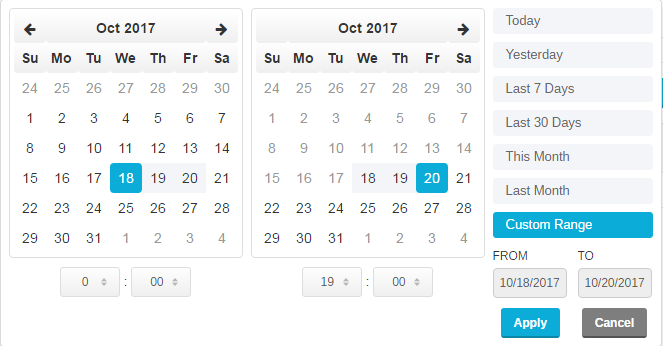
Fig 2. Data Range
Notice: When you compare the report with your partners, we suggest that you’d better choose the same filter with them, like time zone and date range.
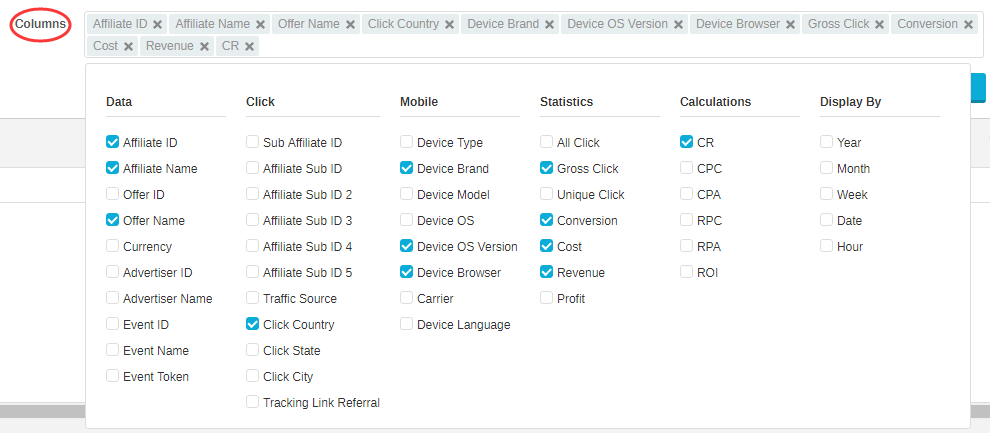
Fig 3. Custom Column
Analysis Report contains many parameters, please refer to document “Report Glossary” to see all the details of the data item.
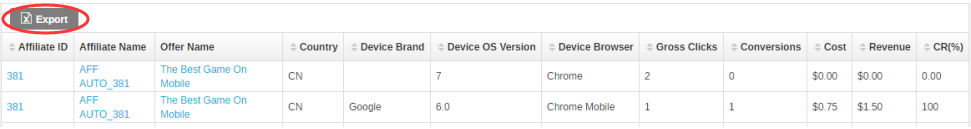
Fig 4. Report page
If you need to further analyze the data, you can click the top left button "Export". After a while, "Download CSV" button will be displayed, click it to export the file in CSV format.
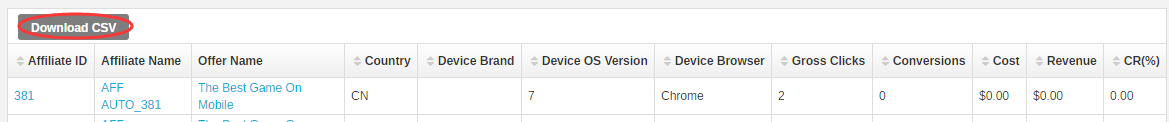
Fig 5. Download CSV
Please pay attention: Do not close the browser while generating the CSV File.
You can go to "Reports -> Analysis Report" to check this report.
I. Filter
You can choose specific Advertisers, Affiliates or Offers to check the performance of Advertising campaign. Fig 1. Filter panel
Notice: You can minimize the Filter panel by clicking the icon on the bottom right corner. For better user-experience..
All Filter Options in Analysis Report are as follows:
1. Advertiser Manager: Filter advertiser managers. You can check the offer's traffic data of specific employee via this option.
2. Advertiser: Filter advertisers to check the data of specific advertiser.
3. Offer: Filter offers to check the traffic characteristics of specific offer.
4. Affiliate Manager: Filter affiliate managers. You can check the traffic characteristics of affiliates who are managed by specific employee via this option.
5. Affiliate: Filter affiliates to check the traffic characteristics of specific affiliate.
6. Event Range: Filter event range.
A. Choose All Event: You can see all events' performance of the offer.
B. Choose Initial Event: You can only see the initial event's traffic data of the offer.
7. Exclude Private Event: Report will not display the data of Offer’s Private Event after open the " Exclude Private Event ".
8. Time Zone: Report by default displays the time zone according to the time zone settings in "Setup -> Settings -> General Settings". If you want to check the report with your Advertiser or publisher, you can switch it to the corresponding time zone to check.
9. Date Range: Filter date range. System provides some fast labels of:
A. Today
B. Yesterday
C. Last 7 Days
D. Last 30 Days
E. This Month
F. Last Month
This makes it more convenient to choose the time range. At the same time, you can also customize the time range by choosing the appropriate date and even the hour.
Fig 2. Data Range
II. Columns
In Analysis Report, you not only can check the regular data such as Clicks and Conversions, but also other data items as shown in bellow snapshot. In addition, all your results can be grouped according to different time periods, such as Year, Month, Week, Date, Hour. Fig 3. Custom Column
Analysis Report contains many parameters, please refer to document “Report Glossary” to see all the details of the data item.
III. Query Data
You can see all corresponding data after click "Run Report" button in Filter panel. Furthermore, you can click on the header to sort it. Fig 4. Report page
If you need to further analyze the data, you can click the top left button "Export". After a while, "Download CSV" button will be displayed, click it to export the file in CSV format.
Fig 5. Download CSV
Please pay attention: Do not close the browser while generating the CSV File.
Close All
Getting Started
Anti-Fraud System
Auto
SmartLlink
Configuration Guide
Integration with FuseClick
Partner Integration with FuseClick
Employees
Advertisers
Offers
Affiliates
Campaigns
Reports
Billings
Tools
Test
Setup


